Login

This login is for members of The Broadway League, who are primarily theatre owners and operators, producers, presenters, and general managers in North American cities, as well as suppliers of goods and services to the commercial theatre industry.

Consumers looking for ticketing accounts should contact directly the theatre where your account is held.

Forgot Password?

Back to login

Research & Statistics
Research Reports

The Broadway League is the clearinghouse for information on the business, demographics, and economic impact of Broadway theatre throughout North America.

The League compiles various statistics and publishes extensive reports on a number of topics. For brief excerpts from recently published reports, click on the links below.

PDF versions of the reports are available for purchase. Order copies here.

The Demographics of the Broadway Audience
2018-2019 SEASON

Introduction

The Demographics of the Broadway Audience 2018-2019 is a profile of the audience at Broadway shows from June 2018 through May 2019. It is the twenty-second annual report in our series, analyzing the composition of the audience today in comparison to past years and attempting to note trends for the future. The report includes information regarding the demographics, ticket purchasing habits, and consumer preferences of the Broadway theatregoer.

From the Executive Summary

  • In the 2018–2019 season, Broadway shows welcomed 14.8 million admissions, an all-time high.
  • Approximately 35% of those attendances were by people from the New York City metropolitan area.
  • Sixty-five percent of admissions were made by tourists: 46% from the United States (but outside New York City and its suburbs) and 19% from other countries.
  • This represents the highest number of attendances by foreign visitors in history— 2.8 million.
  • Sixty-eight percent of the audiences were female.
  • The average age of the Broadway theatregoer was 42.3 years old. This average has hovered between 40 and 45 years old for the past two decades.
  • Along with the overall growth in attendances, the number of admissions by non-Caucasian theatregoers reached a record high of 3.8 million.
  • Of theatregoers age 25 or older, 81% had completed college and 41% had earned a graduate degree.
  • The average annual household income of the Broadway theatregoer was $261,000.
  • The average number of attendances by the Broadway theatregoer was 4.4 in the past year. The group of devoted fans who attended 15 or more performances comprised only 5% of the audience, but accounted for 28% of all tickets (4.15 million admissions).
  • Playgoers tended to be more frequent theatregoers than musical attendees. The typical straight-play attendee saw seven shows in the past year; the musical attendee, four.
  • Respondents reported having paid an average of $145.60 per ticket.
  • Fifty-nine percent percent of respondents said they purchased their tickets online.
  • The average reported date of ticket purchase for a Broadway show was 47 days before the performance, four days more than the previous season.
  • Google was the most common initial source theatregoers named when they were asked where they looked for information about Broadway shows. Ticketmaster and Broadway.com followed Google.
  • Twenty-two percent said that they relied primarily on word-of-mouth from people they knew.
  • Most theatregoers attended in pairs or small groups of family or friends.
  • The vast majority of current theatregoers had some connection to theatregoing as a child.

The Demographics of the Broadway Audience 2018-2019

50 pages, illustrated with color charts and graphs. Published November, 2019.

Order a copy of this report.


Cover and sample page:

Broadway's Economic Contribution to New York City
2018-2019 SEASON

This biennial report analyzes the economic impact of money spent in New York specifically because of Broadway - including dollars spent on mounting and running Broadway productions and maintenance of theatres; as well as monies spent by visitors to New York on Broadway related ancillary spending.

During the 2018-2019 season, the Broadway industry contributed $14.7 billion to the economy of New York City and supported 96,900 jobs.

This amount consisted of direct spending in three areas: spending by producers to produce and run shows; spending by theatre owners to maintain and renovate venues; and ancillary purchases by "Broadway Tourists" (defined as non-NYC residents who said that Broadway was a very important reason for their coming to New York City). The money that was directly spent in these areas was then re-spent in multiple subsequent rounds, until the original sums left New York City. The sum of the subsequent rounds and the original spending total the full contribution of $14.7 billion.

Broadway's Economic Contribution to NYC: 2018-2019 Season 

45 pages, illustrated with color with charts, graphs, and photos.

Order a copy of this report.


Cover and sample page:

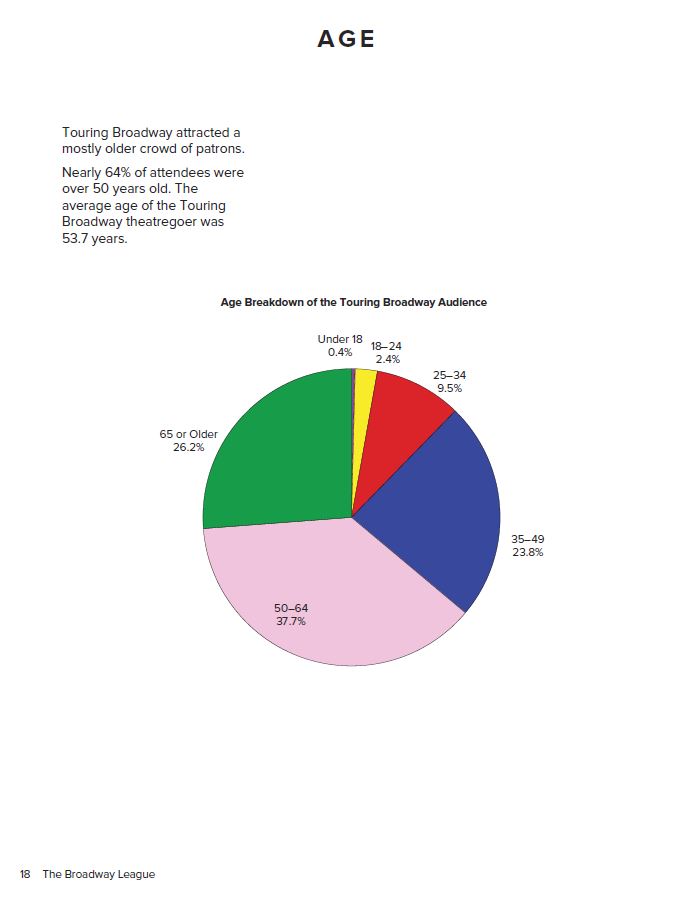
The Audience for Touring Broadway
2017-2018 SEASON

From the Executive Summary

  • In the 2017–2018 season, there were 17 million attendances to Broadway tours across the United States and Canada.
  • Seventy-two percent of attendees were female.
  • The average age of the Touring Broadway theatregoer was 53.7 years.
  • The vast majority of Touring Broadway theatregoers were Caucasian.
  • Of those age 25 or older, 81% of the audience held a college degree and 38% held a graduate degree.
  • Fifty-five percent of national theatregoers reported an annual household income of more than $100,000, compared to only 25% of Americans overall.
  • Thirty-nine percent of respondents subscribed to the “Broadway Series” at their local venues.
  • On average, Touring Broadway attendees saw 5 shows per year.
  • Women continued to be more likely than men to make the decision to purchase theatre tickets.
  • The most commonly cited sources for show selection were personal recommendation; the inclusion in the subscription; emails about the show; and critics’ reviews.
  • The theatres’ websites were, by far, the most important reported source for show information.
  • Sixty-three percent of the audience said that some kind of incentive would encourage them to attend theatre more frequently, such as discounts or special perks.
  • Three quarters of respondents said they used Facebook.
  • Sixty-three percent of non-subscribers said they purchased tickets through the show’s or theatre’s official website.
  • Most Touring Broadway theatregoers attended in small groups of family or friends.
  • More than one-half of the audience said that they were somehow involved or interested in theatre as a child.
  • The vast majority of Touring Broadway theatregoers arrived at the venue by personal car.
  • Sixty-nine percent of respondents said they would prefer to receive theatre information electronically, rather than via postal mail.
  • Thirty-five percent of respondents said they made a visit to New York City in the past year.  Of those, 83% attended a Broadway show while in town.
  • Nine percent of respondents said they spoke a language other than English in their homes.

The Audience For Touring Broadway 2017-2018

62 pages, illustrated with color charts and graphs, published February 2019.


Order a copy of this report.


Cover and sample page:

The Economic Impact of Touring Broadway
2016-2017 SEASON

From the Executive Summary

  • In the 2016–2017 season, 41 Touring Broadway shows traveled to 191 cities across the country.
  • Producers and presenters spent $1 billion to launch and run these tours.
  • Of this amount, $728.8 million was spent in the theatres’ communities and $279.8 million in the  New York City area.  The remaining $29.6 million was spent in other areas (e.g. vendors who were situated elsewhere or foreign royalty holders) beyond the scope of this impact analysis.
  • Moreover, theatregoers who came to an area specifically to attend shows spent another $766.1 million on ancillary activities such as dining and transportation.
  • Thus the total direct spending due to Touring Broadway amounted to $1.8 billion. 
  • This money then generated another $2.0 billion in secondary rounds of spending, so that the full economic contribution of Touring Broadway totaled $3.8 billion to these 191 cities.
  • Eighty-three percent of this money ($3.2 billion) supported the communities that presented Broadway tours.  Another $610.2 million impacted the New York City area.
  • On average, Broadway tours contributed an economic impact of 3.27 times the gross ticket sales to the economy of the metropolitan areas in which they played.


The Economic Impact of Touring Broadway - 2016-2017 Season

31 pages, illustrated with color with charts, graphs, and photos.
Published June 2019, revised August 2020


Order a copy of this report.


Cover and sample page: